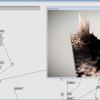
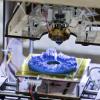
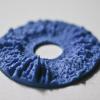
Generative datasculpture visualizing Google Analytics data about visit of iMal.org webpage. The data represents one year cycle with events being visualised as a peaks or falls. Significant events are visible, some of them caused by activity towards public, such as job offers, festival, some caused by external factors, such as holidays, season and weather changes. We could even see weeks, day activity and its significant drop during the night. Even though the object is formed by the data of a technical nature, it still looks very organic as it reflects biorhythms of a community following the activities of the selected cultural organisation.
From the top the object resembles iris of a human eye. The name of the artwork is also an metaphor of how we are observed by a complex computational systems. We all know we are under watch, but we do not understand the implications. Even innocent tools like Google Analytics could be used to invade one’s privacy with harmful consequences.
Goal was to create an artwork that is generated by an algorithm hence raising awareness of expanding creative abilities of information systems, however soon after I realized there is also practical use to the project. While Google Analytics provides flexible tools for data visualization, 3D printing the statistics data adds one more dimension and allows for better insight and understanding of the dataset, hidden patterns become obvious.


